Studio Booth Rental
 Green Screen Photo Booth Rental
 Glam Booth Rental
 Mirror Photo Booth
 Classic Photo Booth Rental
 Light Painting Photo Booth Rental
 Vogue Photo Booth Rental
 Glambot Rental
 360 Photo Booth Rental
 Bullet Time Photo Booth Rental
 Testimonial Booths
 Roaming Photo Booth Rental
 GIF Photo Booth Rental
 Virtual Photo Booth


 Split Flap Display
 Custom Dog Tag Station
 Giant Lite Brite
 Digital Graffiti Wall
 Retail Photo Booth Installation
 Ski Lift Photo Booth
 Custom Photo Booth
 LED Dance Floor
An event analytics report is a post-event summary of what guests did at a brand activation: how many sessions ran, what was captured, how the files were shared, and how many guest contacts were collected, all counted by the booth software, with reach and impressions labeled as estimates.
CEG’s version is built from the booth software’s own log of each booking, and it comes standard with every CEG capture booking, from a single roaming photo booth to a multi-camera array. On CEG’s 2026 rate sheet a roaming photo booth starts from $2,000, an AI photo booth from $5,000, and a 7-camera array from $5,000, each with the report included.
WHAT THE ANALYTICS REPORT MEASURES
The report covers six counted fields and two sets of estimates.
- Sessions: one guest or group turn at the booth.
- Captures by type: photos, GIFs, videos, and AI images.
- Shares by channel: email, text, download, and any direct posts to Instagram, Facebook, or X, with prints logged separately.
- Leads: guest contacts typed at the booth or at a QR sign-up.
- Gallery views: how often guests opened the event gallery.
- Survey answers, where a survey step is set up.
- Estimated reach and impressions: a labeled projection of how far shared files traveled.
- Face-analysis estimates, only where it was on: faces per photo and the crowd’s age and gender split.
The client gets a live dashboard link during the event, then a PDF within 72 hours of close. The dashboard updates as guests use the booth, exports contacts as a CSV at any time for HubSpot, Salesforce, or another CRM, plots every capture by time of day, and keeps counting gallery views for weeks.
HOW THE BOOTH CAPTURES THE DATA
A CEG booth captures report data four ways: a lead form, share-channel tracking, gallery-view tracking, and face analysis where it is switched on. On a corporate brief the first three usually run together, because each one misses something different.
| Four Capture Mechanisms at a CEG Booth | ||
|---|---|---|
| Mechanism | What it records | What it misses |
| Lead form on the booth screen | A name, an email or phone number, any qualifying fields the client adds, and a marketing opt-in | Guests in a hurry and guests who take a download |
| Share-channel tracking | Which route each file took: email, text, or download, with prints logged separately | Where the file goes after it lands, such as a guest’s own social post |
| Gallery-view tracking | Opens of the event gallery link, for weeks after the event | Anything on the day; views arrive after load-out |
| Face analysis, by client request | Faces in frame and an estimated age and gender split, with no name stored | Faces turned away or blurred by motion; it describes the crowd, never a person |
Put plainly, the lead form misses guests in a hurry and guests who only take a download, share tracking stops once a file lands, gallery views arrive only after load-out, and face analysis skips faces turned away or blurred, which is why the first three usually run together.
Peyton Vincent walks through QR pre-registration at a 360 booth, from the sign in the line to sharing that finishes on its own.
Transcript summary: guests in line scan a QR code on a sign, enter an email or phone number on a client-branded page, and show the code they receive to the attendant, who scans it to start the session. Guests still review their clip on the iPad, but delivery goes out automatically, so nobody waits at a sharing tablet and each session takes about half the time.
PLANNER PLAYBOOK FOR BOOTH LEAD DATA
Five decisions made before the event decide whether the booth data is usable (practical guidance, not legal advice).
Consent for follow-up
A contact typed to receive a photo is a delivery address, not permission to market. Add a separate opt-in, worded by the brand that will follow up, and send sales only the guests who checked it. In the United States, the TCPA requires prior express written consent before marketing texts, and CAN-SPAM requires a sender name, postal address, and unsubscribe in every marketing email; GDPR and CASL usually call for express consent for marketing. Reusing guest photos in ads is the client's call; CEG advises a separate opt-in line for it.
"We start the marketing opt-in unchecked. Add any qualifying field you want, such as job title, company, or product interest, but each one costs every guest a few seconds at the booth."
Peyton Vincent, founder, CEG Interactive
Cost per lead and pipeline
Divide the full activation cost by opted-in leads, not all contacts: $10,000 with 400 opted-in guests is $25 per lead. A lead is worth average deal size times the close rate from event leads; at $5,000 and 5%, about $250, so 400 carry about $100,000 in expected pipeline. Judge it 60 to 90 days out, once sales has worked the list, not on event-week numbers.
Face analysis, off by default
As of September 2026, CEG turns face analysis on only when the client requests it and the location allows it; Illinois, Texas, and Washington restrict face scanning. When it runs, a sign tells guests the software estimates age and gender, no names are stored, and the report shows crowd totals only.
Booth count and QR pre-registration
Without QR pre-registration, one booth runs about 60 guest sessions an hour, an AI photo booth or 360 photo booth included (an AI render arrives 1 to 2 minutes later). A 3-hour reception for 500 guests tops out near 180 sessions per booth, so reaching more of the room takes a second booth or QR pre-registration, a $1,000 upgrade that roughly doubles that rate. Guests fill a short form on their phone while they wait and the booth sends the photo from that record, which cuts each guest's time at the booth about in half. The calculator below models both.
Connection and CRM handoff
Email and text need data. Where venue Wi-Fi and cellular slow down, as in a packed expo hall, CEG can add Starlink, antenna outdoors. Before the event, agree who receives the CSV export, which CRM fields it maps to, and who sends the first follow-up, ideally within 48 hours while the photo is fresh.
598 EVENTS OF CEG BOOTH DATA
CEG's current booth software account holds 598 capture events from April 2022 to August 2026, with 67,735 guest sessions, 54,141 shares, 34,232 guest contacts, and 236,320 gallery views counted.
Share and contact counts begin in May 2023, and contacts were logged at 320 of the 598 events. The face total comes from the 429 events where face analysis ran, all before September 2026. With the older archive and an earlier account, CEG has logged more than 211,000 guest sessions.
| A Typical CEG Capture Event, by the Numbers | ||
|---|---|---|
| Measure | Median (middle half) | Events counted |
| Sessions per event | 82 (45 to 137) | 572 |
| Shares per session | 1.5 (1.0 to 1.9) | 324 |
| Guest contacts per session, events that logged them | 0.97 (0.71 to 1.18) | 320 |
| Gallery views per share | 1.9 (1.5 to 2.7) | 324 |
Most of those contacts are delivery addresses, not opted-in leads: at 219 of the 324 events with shares, the contact count equals the email and text sends exactly. Guests pick text over email by 5.7 to 1 (28,805 text, 5,082 email sends), so a form that asks only for an email address leaves most guests out. Plan on the medians; a few large shows pull the averages above them.
By the capture type each event logged (333 events), the medians split by format: photo booths 87 sessions and 1.5 shares per session (204 events), AI photo booths 148 sessions and 1.0 (51), video booths including 360 and camera arrays 55 sessions and 1.9 (59), and GIF booths 111 sessions and 1.3 (19).
WHICH NUMBERS TO READ FOR YOUR BRIEF
Each type of brief reads a different part of the report, and that proof matters: in Vendelux's 2026 B2B Events Survey of more than 120 marketing and events leaders, 98% said they struggle to justify event spend to leadership.
Opted-in leads divided by sessions: how often a turn became a contact sales can use.
Shares and counted gallery views first; estimated reach and impressions only as context.
A one-question survey step, such as role or product interest, describes who came, at about 5 seconds per guest.
The most-viewed captures show which look or prop drew guests, a guide for the next activation.
The tradeoff sits at the share screen. Email and text ask for contact details, so they feed the lead count; a download adds a share but no lead unless the guest registered by QR in line. A lead-generation brief steers guests to email or text; an awareness brief can open every channel.
When booth data is not the priority
"At a social event, or an internal event where you already know everyone, there is no new data to capture. Sharing and keepsakes are the point there, and the dashboard counts still come with the booth."
Peyton Vincent, founder, CEG Interactive
Turn the lead form off to keep the line near one session per minute, and spend on keepsakes. Digital sharing is free on every CEG booth; prints are a paid upgrade on most (Sketch Bot and the Classic Enclosed Booth include them) and are what employees carry home from a holiday party booth or a team offsite. The photobooth gallery link stays open for weeks after the event, so it works as a keepsake too. A small sample points the same way: at the 19 social events that logged shares, guests shared a median of 1.7 times per session, against 1.5 at 305 other events with shares, a gap inside the normal spread between events.
Where a badge scan, lead retrieval app, or event-app check-ins already capture every visitor, that list is the better lead source. With minors, or healthcare, government, or school audiences, keep face estimates and lead forms off. To prove sales lift, add a UTM-tagged landing page or promo code.
A REAL CLIENT REPORT: LG AT PAX WEST

Guests line up at the LG webOS Gaming booth at PAX West, where the multi-camera bullet time stage sits behind the Snap and Share screen.
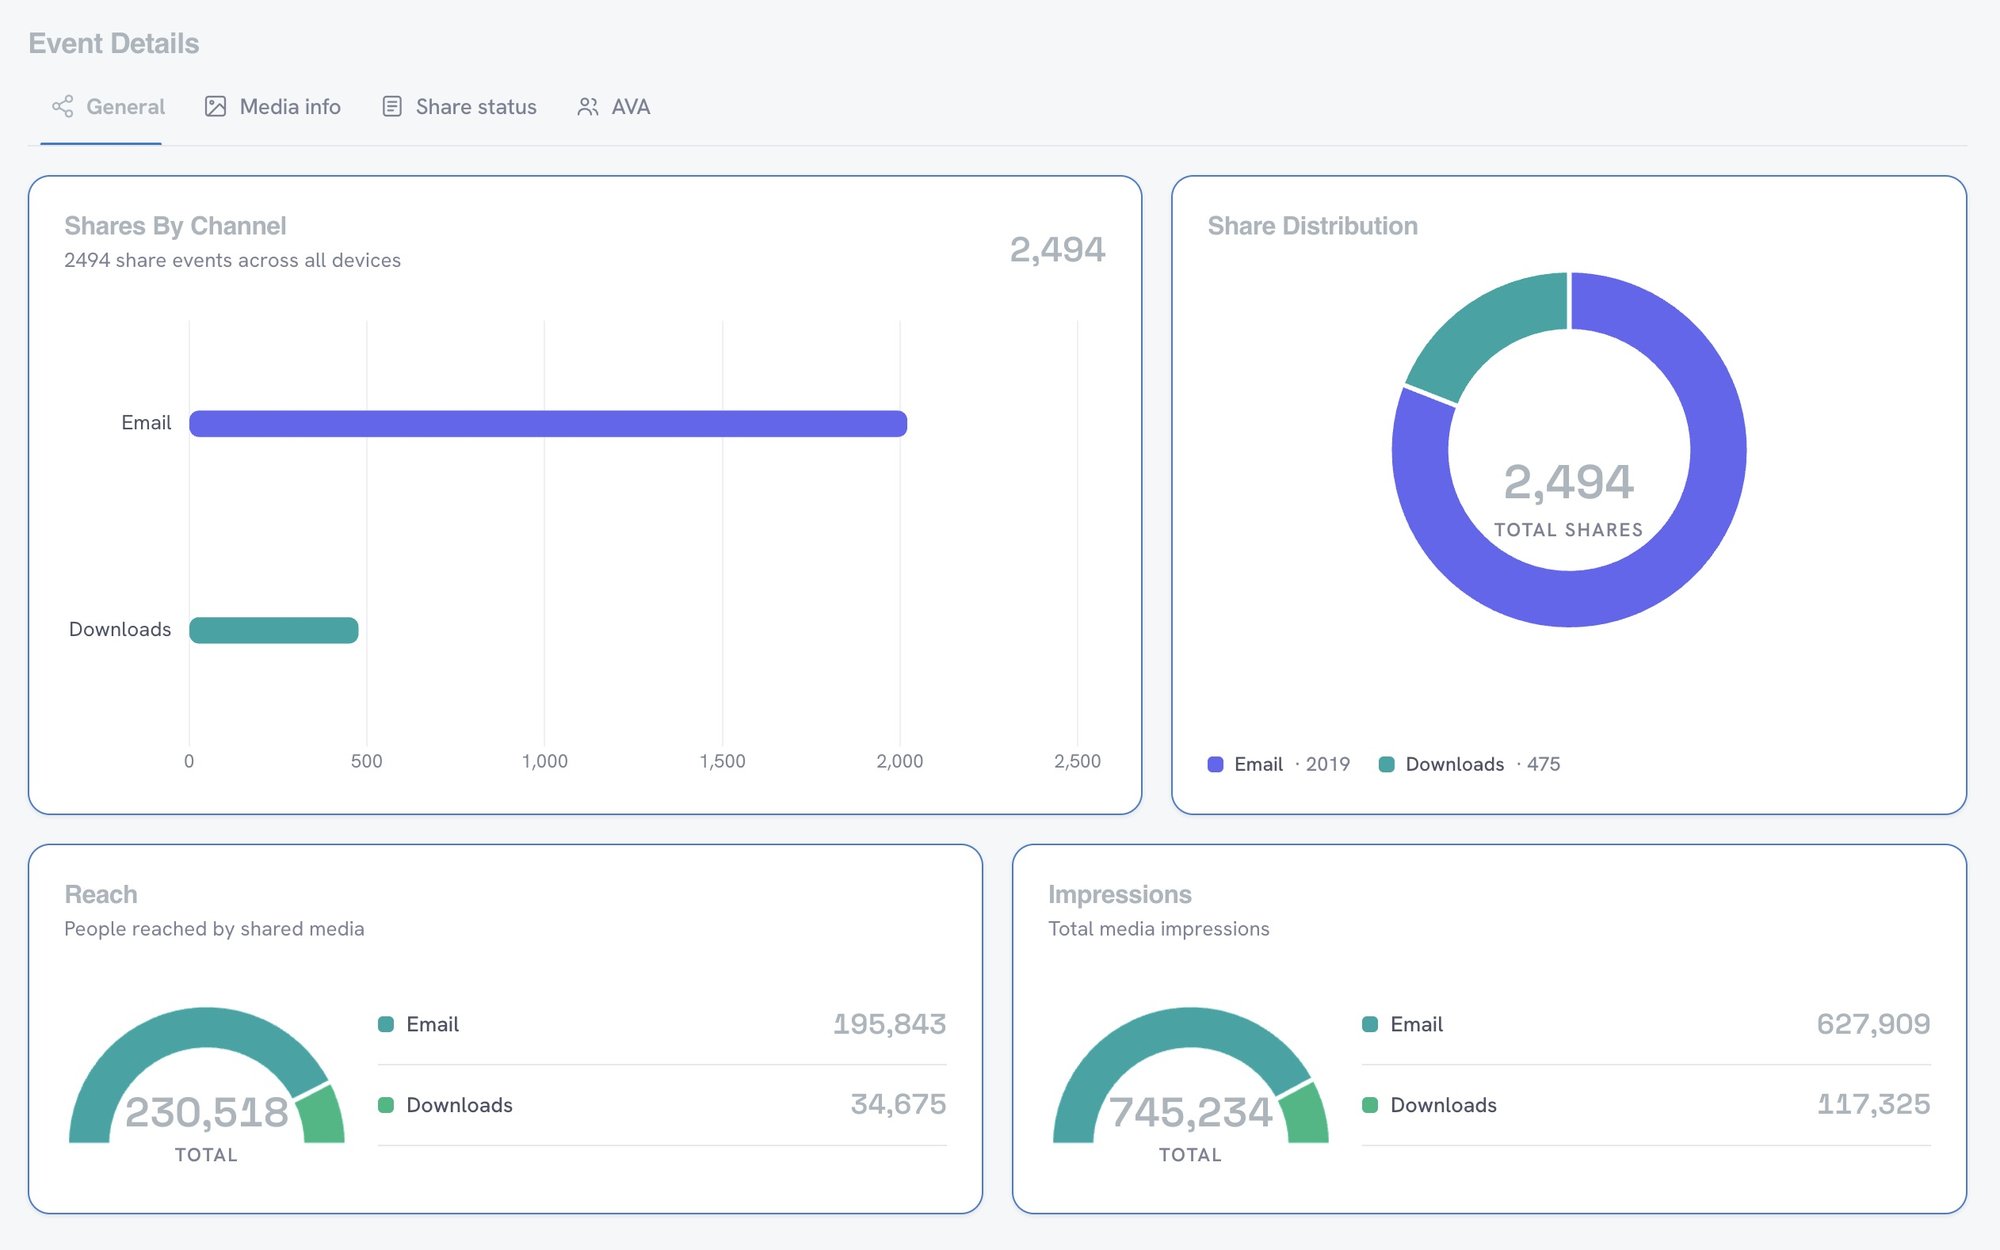
LG's analytics report from PAX West 2024 in Seattle counted 5,287 sessions, 2,494 shares, and 2,019 leads over four days, from a multi-camera array CEG ran through the agency HSAD from August 30 to September 2, 2024.
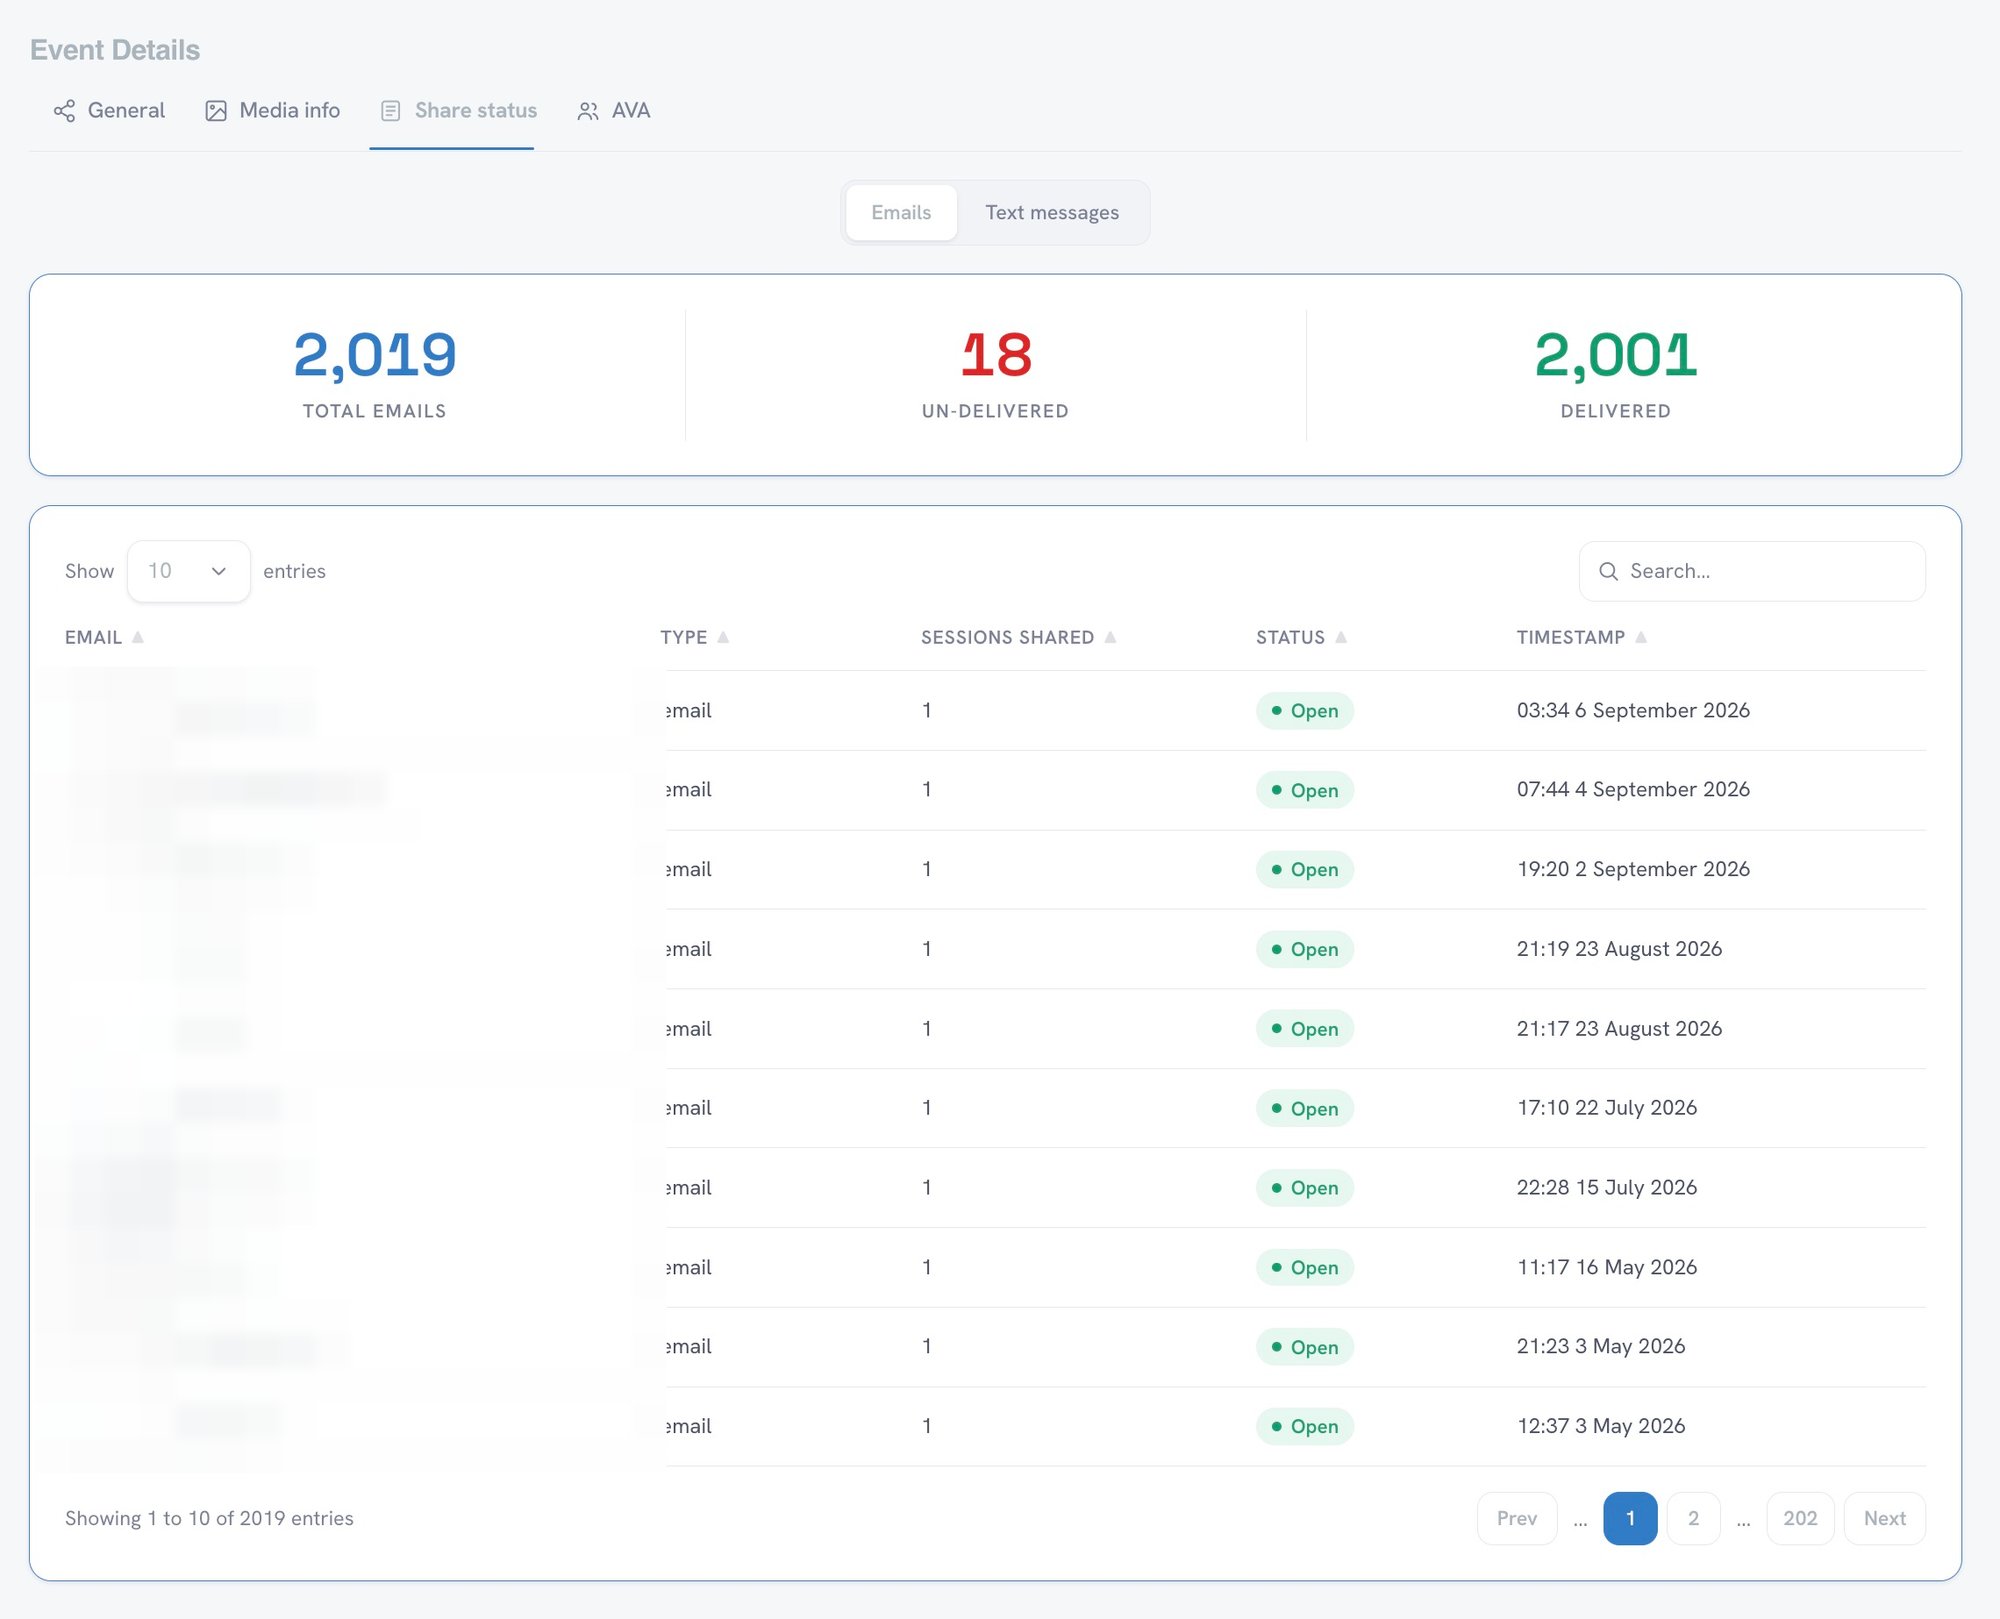
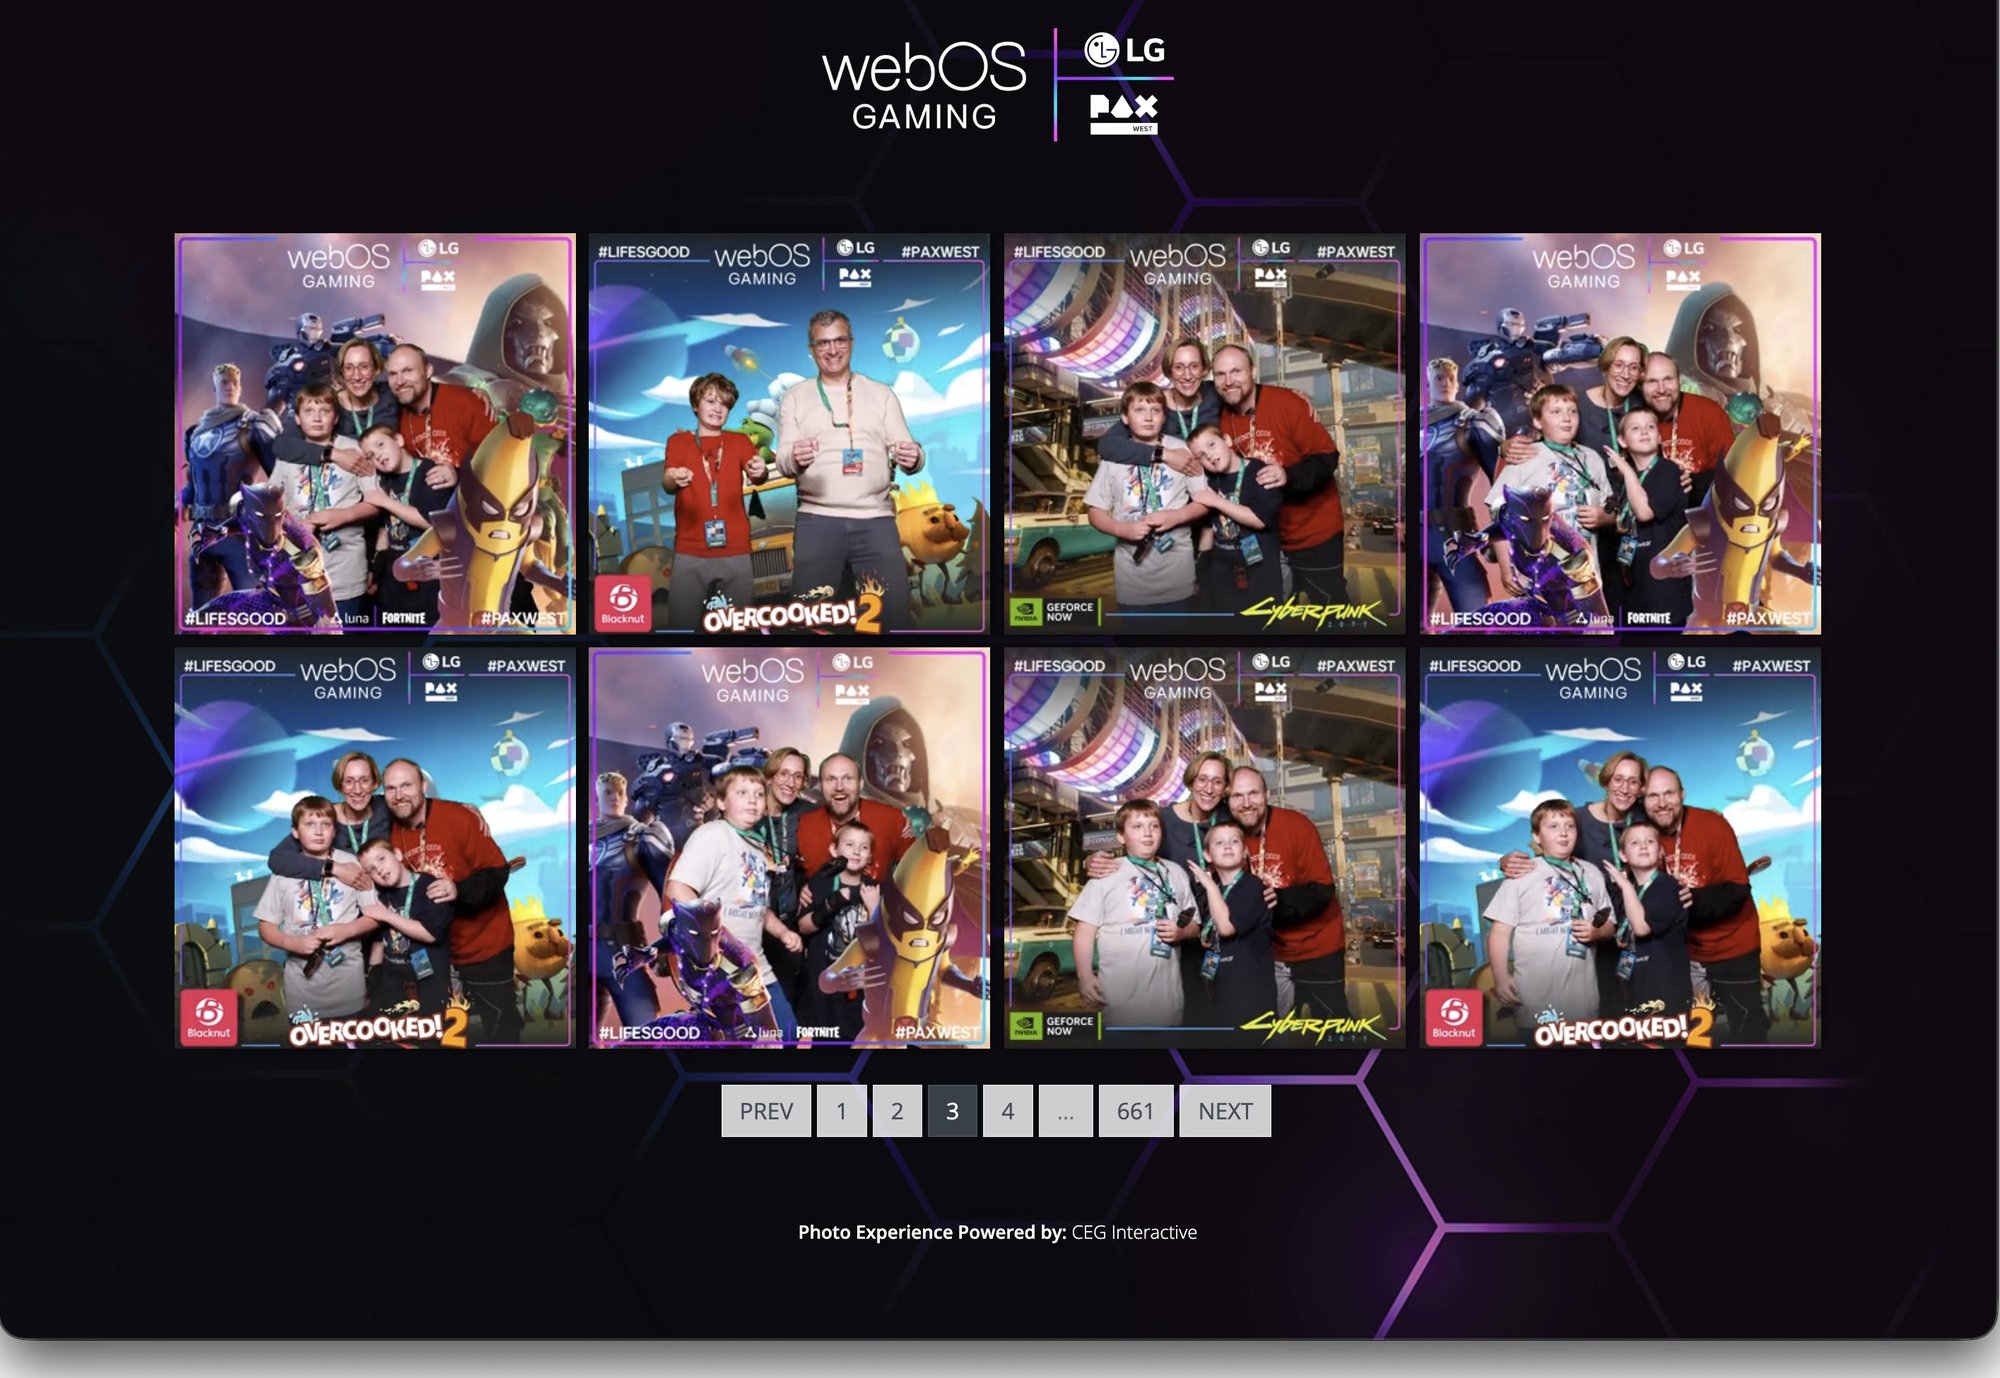
Every session produced a video. Of the 2,494 shares, 2,019 went by email and 475 by download, and the 2,019 leads match the email count one for one: 38% of sessions ended in an email share, and that list, filtered to guests who opted in to follow-up, is what goes back to sales. The gallery counted 1,873 views against 230,518 estimated reach and 745,234 estimated impressions from the booth software's defaults.
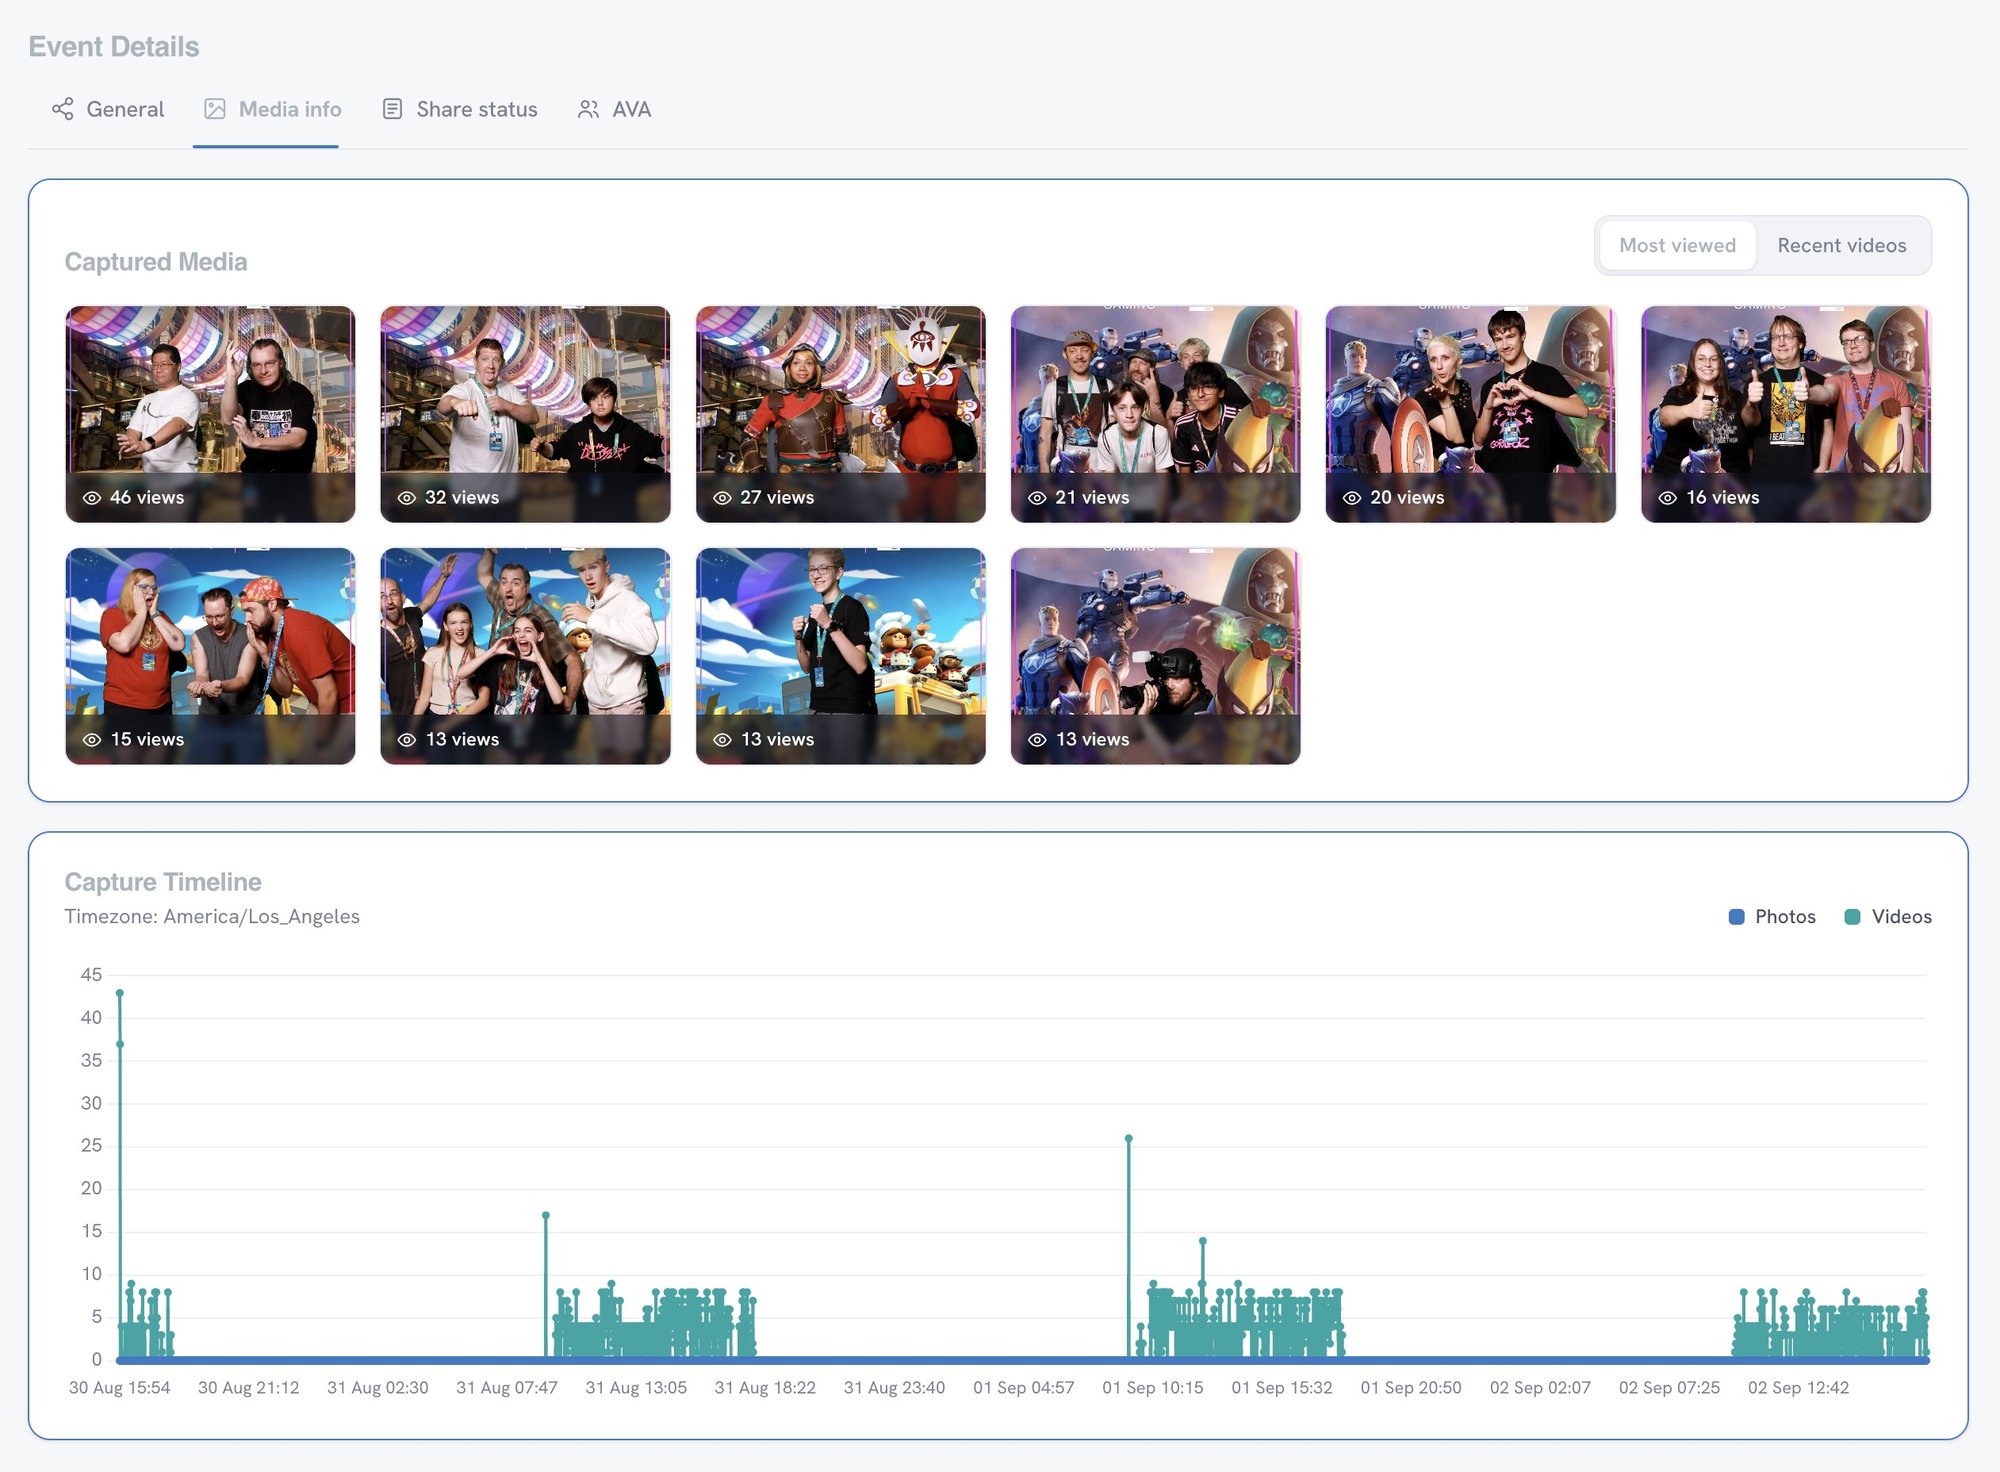
The dashboard tabs below are LG's report itself: shares, reach and impressions by channel, email delivery (2,001 of 2,019 delivered), the most-viewed captures with the capture timeline, which shows a steady flow through each show day, and the branded gallery.
Download the sample report (PDF, 2 pages): LG's PAX West figures in report form, with guest names, contact details, and face estimates removed.
HOW ESTIMATED REACH IS BUILT
Estimated reach in the report is a projection, not a count: the booth software multiplies each share by a default factor per channel, set by the software maker rather than measured from what guests post. Neither estimated reach nor estimated impressions is a head count.
Across CEG's account those defaults project 4,051,286 people reached and 13,594,406 impressions: about 75 people per share, roughly 17 times the gallery views the booth actually counted (4.4 per share, 1.9 at a typical event), because they assume guests post to social feeds the booth cannot see. LG's estimates above reproduce exactly from its 2,019 email shares and 475 downloads at the same factors.
The calculator below gives a rough range before booking; after the event, counted figures replace every estimate.
Photo Booth Reach Calculator
Estimate a booth's results before the event; the platform and social benchmark figures come from two separate methods, so read them side by side, not as one range.
Estimated impressions, platform multipliers
18,000
Platform high 28,000 · Social benchmark 410
Platform figure, high case under each. The media-equivalent estimate is a rough ad-rate comparison, not revenue or earned media.
- Sessions
- 120High 150
- Shares
- 72High 110
- Guest contacts, not opted-in leads
- 120High 150
- Gallery views
- 320High 500
- Estimated reach
- 5,400High 8,400
- Media-equivalent estimate
- $140Benchmark $3, high $210
How the math works and where the defaults come from
With the defaults, one photo booth open 4 hours runs about 120 sessions and 72 shares. At the booth platform's default multipliers, those shares come to about 5,400 estimated reach and 18,000 estimated impressions, a media-equivalent estimate of about $140 at a paid-social ad rate. The social benchmark method, built on counted gallery views, puts impressions at about 410 ($3), and the high case reaches about 28,000.
- Sessions = hours x sessions per hour x share of hours with a line x booths. About 60 an hour per booth and 120 per dog tag machine (CEG, September 2026), doubled with QR pre-registration; a line half the time, checked against the median CEG event of 82 sessions.
- Shares = sessions x 0.6, set below the CEG account's 0.94 per session since May 2023 and the 1.5 median.
- Guest contacts = sessions x 0.97 with a form or QR (median at 320 CEG events, delivery addresses included), or shares x 63% by email or text without.
- Gallery views = shares x 4.4, counted across CEG's account.
- Platform method: shares x 74.8 estimated reach and 251.1 estimated impressions per share, booth software defaults, not a count.
- Benchmark method: shares x (gallery views per share + 10% posted x 200 followers x 5.5% organic reach, from Socialinsider), with a fixed 0.5% reshare rate; 10%, 200, and 0.5% are CEG planning assumptions.
- Media-equivalent estimate = impressions / 1,000 x $7.50 CPM (WebFX, November 2025). High case = 1.25x sessions and shares per session.
WHAT CLIENTS SAY
CEG Interactive averages 4.8 out of 5 across 208 post-event surveys, with 87% of survey respondents rating CEG five stars, alongside 200+ five-star Google reviews.
... The team went ABOVE AND BEYOND to ensure our end client was happy. They were accommodating with last minute changes. ...
CEG is always an amazing partner — already looking forward to the next event.
Always professional, accommodating and easy to work with. Thanks team CEG for another successful event!
Peyton jumped in to find a better solution for our group and created the AR options.
We hired CEG for Burlington's Leadership Summit — our Senior Vice Presidents and executives joined in.
You're always on time, prepared for anything and so creative. We love working with you!
Working with CEG was a breeze — they handled the entire setup without pulling our team away.
To say the photo op was a hit is the understatement of the century. People loved it!
Communicative, punctual, and professional — they take pride in their work.
CEG is always a dream to work with — professional, timely, and warm.
Everyone had a great time — the onsite staff was great!
Grant was great and did a super job! Thank you!
PAIRS WELL WITH
These four formats report on the same dashboard:
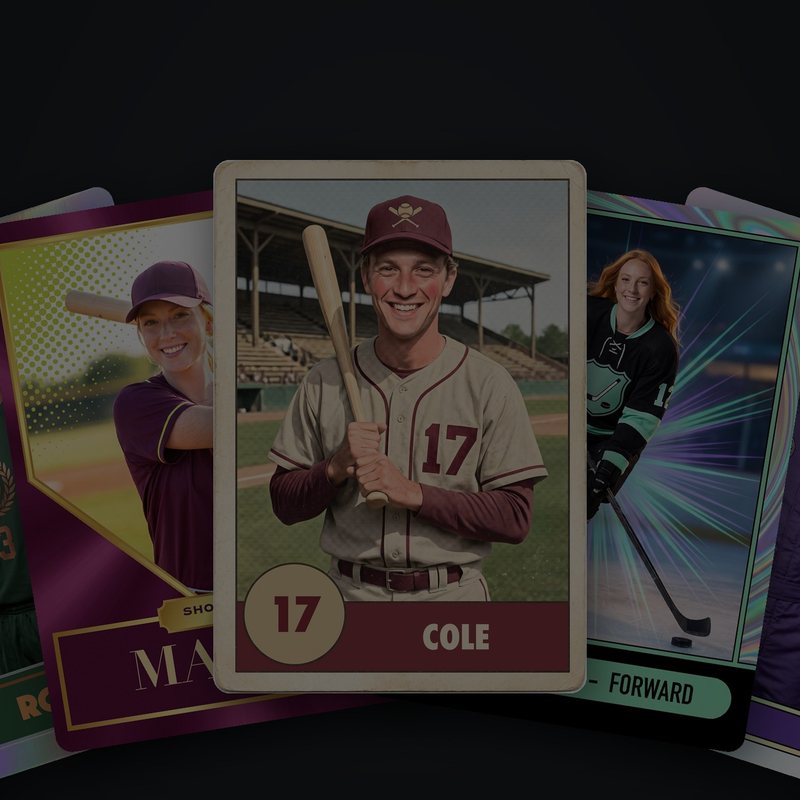
When guests pick a theme, a product, or a prompt, the choices they make land on the report as preference data.

A story studio at a conference records guests on video, counted like photos.
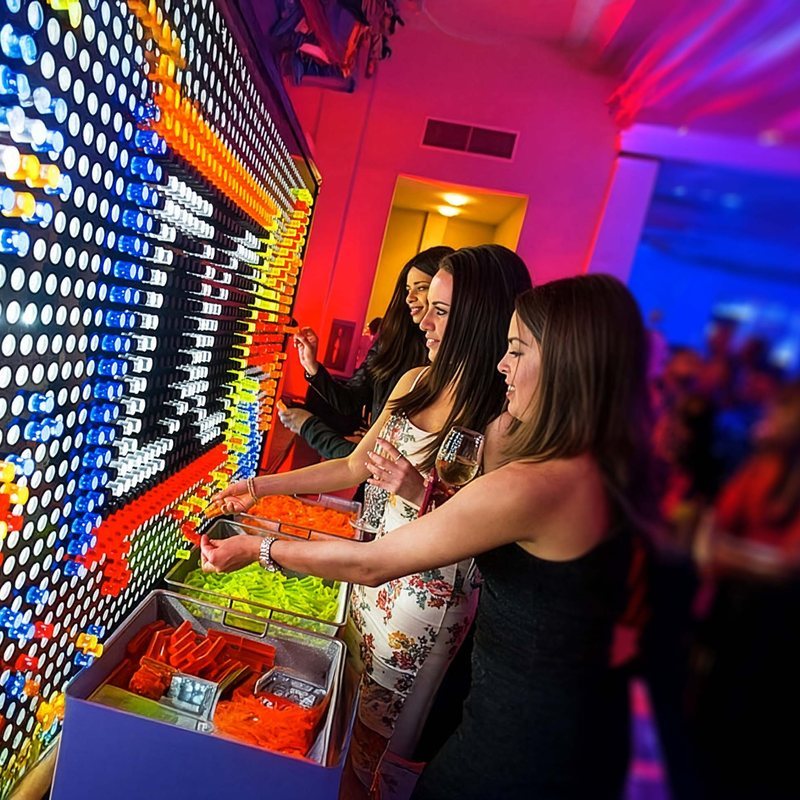
A shared build is measured by contributions, shares, and gallery views.
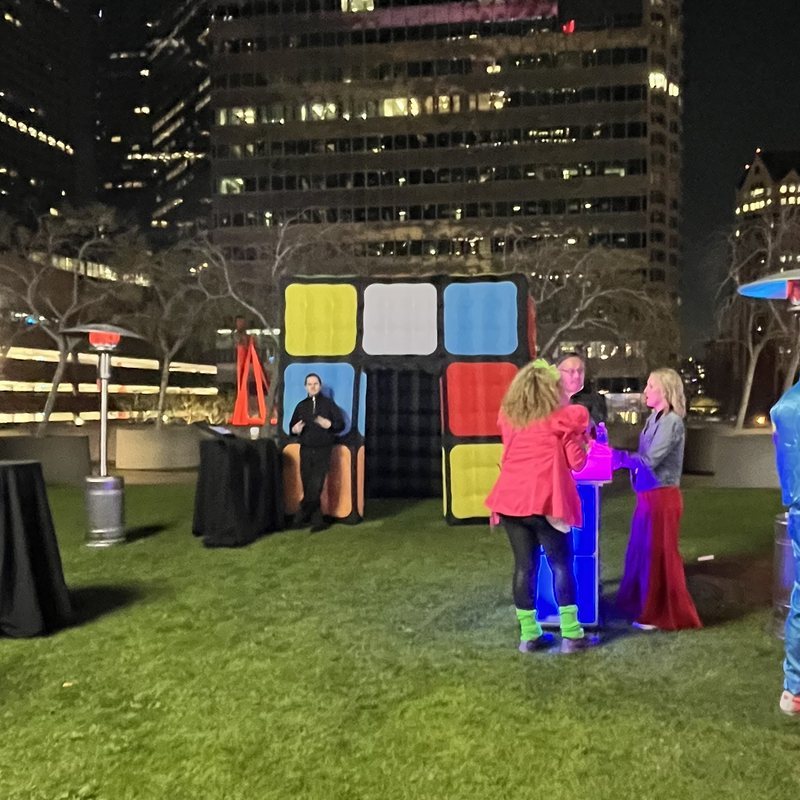
A portrait studio or a secret room gets its own count of how many guests got in and what they sent out.